
Monitoring
Monitoring - what is it and why is it needed?
Climate protection monitoring is used to collect and process data in order to measure the impact of the city of Jena's climate protection activities on a continuous and long-term basis.
The city has been regularly recording energy consumption and greenhouse gas emissions since 2007 and documenting these in monitoring reports. The long-term goals are to reduce electricity and heat consumption in households, commerce and administration, to reduce energy consumption in private transport and to promote renewable energies and combined heat and power generation. In 2021, the city set itself the ambitious goal of becoming climate-neutral by 2035. The Climate Action Plan was adopted for this in 2023. The climate protection monitoring for the Climate Action Plan is now intended to document and communicate Jena's progress towards climate neutrality on an annual basis.
The current monitoring report for the year 2023
The current monitoring report summarizes the results for the year 2023. The energy and greenhouse gas balances compiled provide a differentiated analysis by sector (industry, trade / commerce / services [GHD], private households and mobility) and by energy source (fuels, electricity, natural gas, district heating).
The most important results of the monitoring are summarized here. The detailed report can be found under Downloads.
Energy consumption
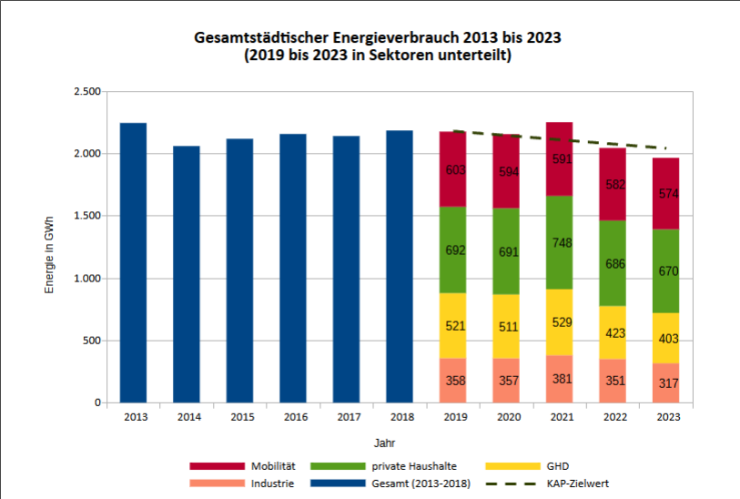
The current development of energy consumption in the city as a whole, broken down into the sectors of industry, trade / commerce / services, private households and mobility, is shown in Figure 1. The dashed line shows the target value from the Climate Action Plan.
Energieverbauch Jena 2013 bis 2023
© ThINK – Thüringer Institut für Nachhaltigkeit und Klimaschutz GmbH
Textuale Beschreibung der Abbildung 1 - für Menschen, die die Abbildung nicht sehen oder Screenreader benutzen
Title of the chart
Total urban energy consumption 2013 to 2023 (2019 to 2023 divided into sectors);
Axis labels
- Y-axis: Energy in gigawatt hours (GWh), scale from 0 to 2,500,
- X-axis: years from 2013 to 2023; representation: 2013 to 2018: total energy consumption as blue bars. 2019 to 2023: Total energy consumption broken down by sector. Additional: green dashed line labeled "KAP target value";
Colors / sectors
Dark red: mobility, pink: industry, yellow: trade, commerce and services, green: private households, dark blue: total 2013-2018, green dashed line: KAP target value;
Values in detail (in GWh):
- 2013: approx. 2,200 (total), 2014: approx. 2,050 (total), 2015: approx. 2,100 (total), 2016: approx. 2,150 (total), 2017: approx. 2,100 (total), 2018: approx. 2,200 (total),
- Sectoral breakdown from 2019:
- 2019 (total approx. 2,174): mobility: 603, private households: 692, trade, commerce and services: 521, industry: 358,
- 2020 (total approx. 2,055): Mobility: 594, private households: 691, tertiary sector: 511, industry: 357,
- 2021 (total approx. 2,249): Mobility: 591, private households: 748, tertiary sector: 529, industry: 381,
- 2022 (total approx. 2,042): Mobility: 582, Private households: 686, TTS: 423, Industry: 351,
- 2023 (total approx. 1,964): mobility: 574, private households: 670, tertiary sector: 403, industry: 317
The graphic or figure was created by ThINK, the Thuringian Institute for Sustainability and Climate Protection GmbH.
For the year 2023, it can be seen that less energy was consumed in all sectors than in 2019, the base year of the Climate Action Plan. Furthermore, final energy consumption in Jena has fallen more sharply than the target set in the Climate Action Plan. Specifically, the energy reduction targets were exceeded in the industry and trade / commerce / services sectors, while they were missed in the private households and mobility sectors.
Greenhouse gas emissions
Greenhouse gas (GHG) emissions are calculated on the basis of the energy balance using specific emission factors.
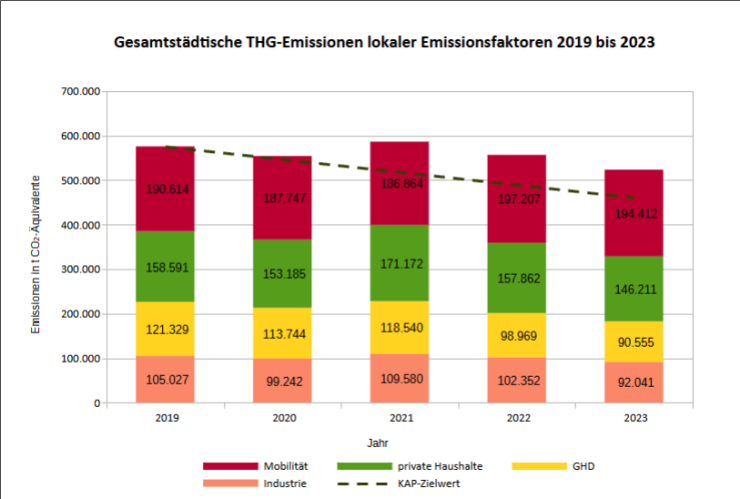
The development of the city's overall GHG emissions by sector is shown in Figure 2. The dashed line again shows the target value from the Climate Action Plan.
Treibhausgas-Emissionen in Jena von 2019 bis 2023 nach lokalen Emissionsfaktoren unterteilt
© ThINK – Thüringer Institut für Nachhaltigkeit und Klimaschutz GmbH
Textuale Beschreibung der Abbildung 2 (für Menschen, die die Abbildung nicht sehen oder Screenreader benutzen)
Title of the graphic
"Total urban GHG emissions of local emission factors 2019 to 2023"
Axis labels
- Y-axis: "Emissions in t CO₂ equivalents" (from 0 to 700,000 in steps of 100,000)
- X-axis: "Year" (2019, 2020, 2021, 2022, 2023)
Illustration
The graphic shows a stacked bar chart with the annual greenhouse gas emissions (GHG) in various sectors. The values are given in tons of CO₂ equivalents. A dashed dark green line is also shown, which represents the "KAP target value".
Colors and sectors
- Red: Mobility
- Orange: Industry
- Yellow: tertiary sector (trade, commerce, services)
- Green: private households
- Dark green dashed line: KAP target value
Values in detail (total per year and by sector)
- 2019 (total emissions approx. 575,561 t CO₂ equivalents)
- Mobility: 190,614
- Industry: 105,027
- GHD: 121,329
- Private households: 158.591
- 2020 (total emissions approx. 553,918 t)
- Mobility: 187,747
- Industry: 99,242
- GHD: 113,744
- Private households: 153.185
- 2021 (total emissions approx. 585,156 t)
- Mobility: 186,864
- Industry: 109,580
- GHD: 118,540
- Private households: 171.172
- 2022 (total emissions approx. 556,390 t)
- Mobility: 197,207
- Industry: 102,352
- GHD: 98,969
- Private households: 157.862
- 2023 (total emissions approx. 523,219 t)
- Mobility: 194,412
- Industry: 92,041
- GHD: 90,555
- Private households: 146.211
Trends
- Total emissions fluctuate between 2019 and 2023: initially a slight decrease (2020), then an increase (2021), followed by a further decrease (2022 and 2023).
- Between 2019 and 2023, there is an overall downward trend: from around 575,000 tons to 523,000 tons of CO₂ equivalents.
- Mobility remains the largest emitter over the entire period (always around 185,000-197,000 tons).
- Private households are the second largest sector, albeit with a slight decline.
- Industry and tertiary trade show greater reductions over time.
- The "KAP target value" (dashed line) decreases continuously, but is slightly below the actual emissions every year.
The graph or figure was created by ThINK, the Thuringian Institute for Sustainability and Climate Protection GmbH.
It can be seen that although the city's overall GHG emissions in 2023 have fallen compared to 2019, the target value of the Climate Action Plan has been missed by a wide margin. With the exception of the trade / commerce / services sector, GHG emissions in all sectors are above the target values of the Climate Action Plan.
The reduction in GHG emissions targeted by the Climate Action Plan is based on two effects:
- a gradual reduction in energy consumption and
- a shift in the composition of energy sources towards more renewable energies.
Energy consumption in Jena has been further reduced, but the replacement of fossil fuels with renewable energies has not progressed as quickly as intended, meaning that the ambitious target path from the Climate Action Plan could not be achieved in 2023.
Switch to renewable energies
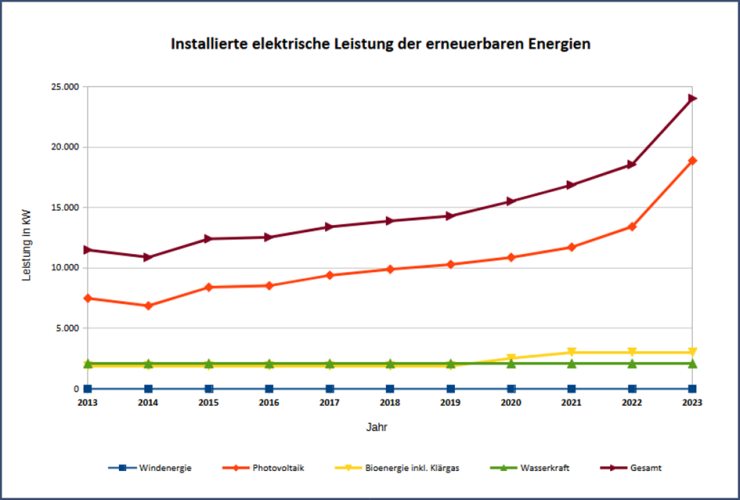
The expansion of renewable energy generation plants in Jena made significant progress in 2023. As Figure 3 shows, photovoltaics is the main source of installed capacity from renewable energies and also recorded the largest increase in 2023.
Installierte elektrische Leistung der erneuerbaren Energien
© ThINK – Thüringer Institut für Nachhaltigkeit und Klimaschutz GmbH
Textuale Beschreibung der Abbildung 3 (für Menschen, die die Abbildung nicht sehen oder Screenreader benutzen)
Title of the graphic
"Installed electrical output of renewable energies"
Axis labels
- Y-axis: "Capacity in kW" (0 to 25,000 in steps of 5,000)
- X-axis: "Year" (2013 to 2023)
Representation
The graph shows a line chart representation of the development of installed electrical output from various renewable energy sources in the period from 2013 to 2023. The total sum of all renewable energies is also shown.
Legend and colors
- Wind energy: dark blue (squares)
- Photovoltaics: orange (diamonds)
- Bioenergy incl. sewage gas: yellow (triangles pointing downwards)
- Hydropower: green (triangles pointing upwards)
- Total: dark red (triangles pointing upwards)
Values and developments in detail
- Wind energy (blue): Remains constant at just under 0 kW over the entire period (virtually no installed capacity).
- Photovoltaics (orange): Started 2013 at around 7,500 kW. Slight decline in 2014, then continuous increase: approx. 9,500 kW in 2017, over 10,000 kW in 2019, around 12,000 kW in 2021, significant jump to around 14,000 kW in 2022 and strong increase to approx. 18,000 kW in 2023.
- Bioenergy incl. sewage gas (yellow): Constant values of around 2,000 kW between 2013 and 2019, followed by a slight increase: around 2,500 kW in 2020, just under 3,000 kW in 2021 and finally around 3,500 kW in 2023.
- Hydropower (green): Almost unchanged over the entire period at around 2,000 kW.
- Total (dark red): Start in 2013 at approx. 11,500 kW. Slight decline in 2014 to around 11,000 kW, then continuous increase: around 13,000 kW in 2017, around 14,500 kW in 2019, over 15,000 kW in 2020, just under 18,000 kW in 2022, and finally a very sharp increase to just under 24,000 kW in 2023.
Trends and key statements
- The total output of renewable energies will increase significantly in the long term, especially from 2019.
- Photovoltaics is by far the most important and fastest-growing source, with a significant jump in output between 2021 and 2023
- Bioenergy grows moderately, especially from 2020.
- Hydropower remains stable.
- Wind energy plays virtually no role in this period.
The graphic or figure was created by ThINK, the Thuringian Institute for Sustainability and Climate Protection GmbH.
However, in 2023, only around 7% of the city's total consumption was covered by electricity generated from renewable energies. In the heating sector, only 2% of the city's total consumption was generated from renewable energies.
My CO₂ balance sheet
Every individual can reduce their CO₂ emissions. But how many tons of CO₂ do you actually emit each year? Where are the levers for avoiding CO₂ emissions? How can I make a concrete contribution to protecting the climate?
With the Federal Environment Agency's CO₂ calculator
you can determine your personal CO₂ emissions for the areas of heating & electricity, mobility, food and other consumption within a few minutes.